CVEasy AI · Exposure Chart
Exploited before most teams could patch
Over the two weeks ending August 19, 2026, the CVEasy threat-intel bundle logged eight supply-chain CVEs that carried a published CVSS score. This chart plots each one by that score, with a rust dot marking the flaws confirmed under active exploitation. The gap that matters is not the bar length; it is how quickly attackers arrived after the fix or the disclosure.
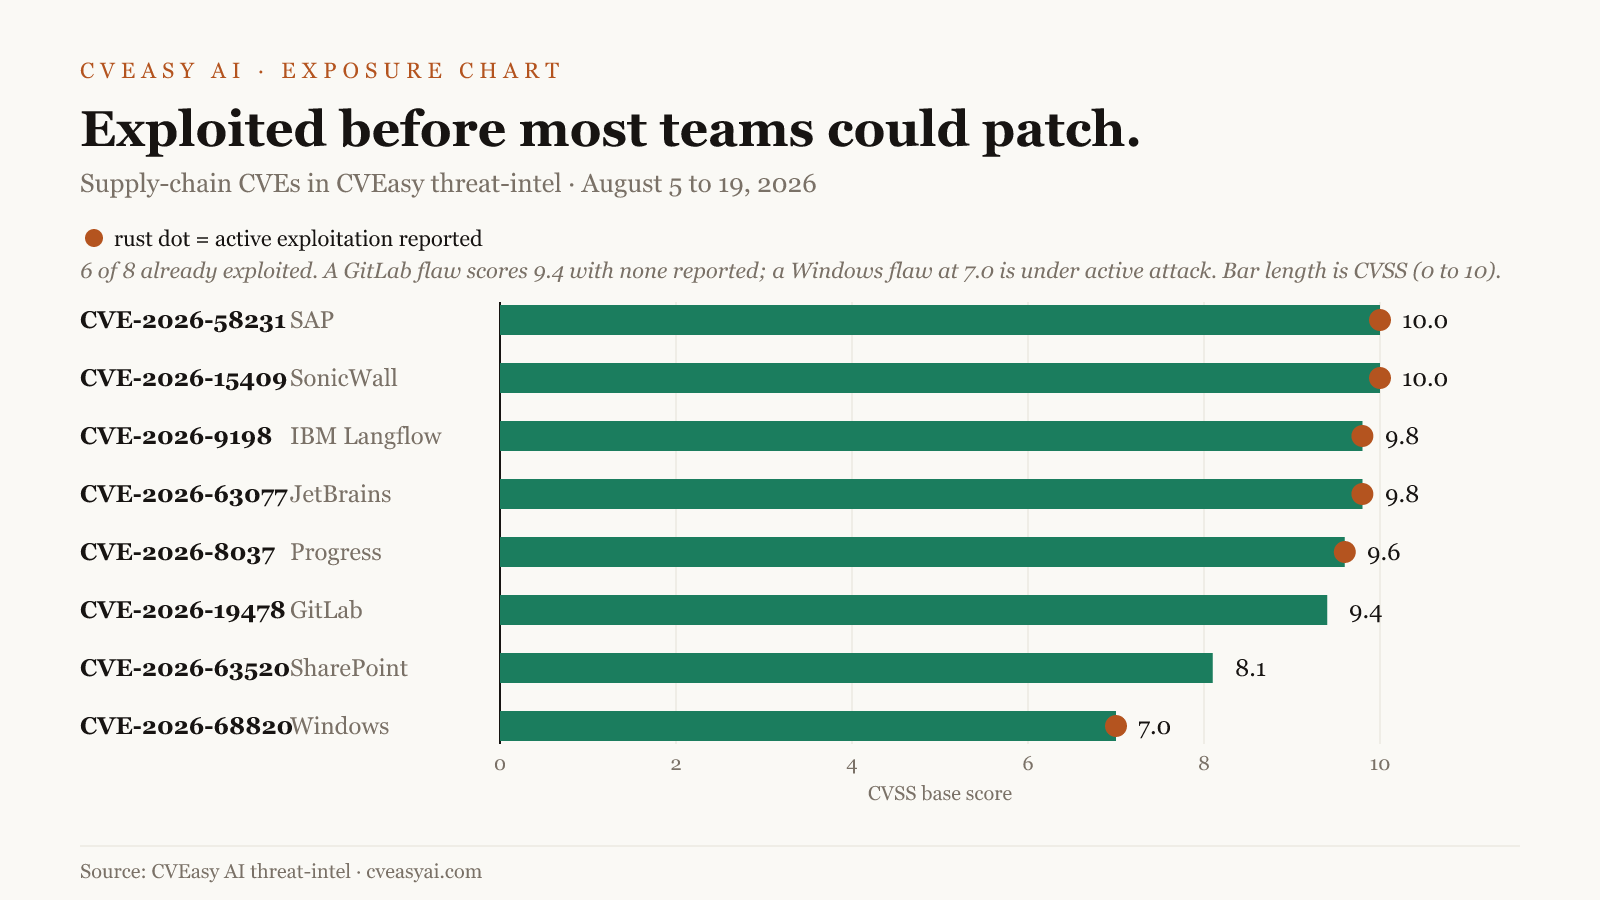
Six of the eight were already being exploited. SAP Commerce Cloud (CVE-2026-58231, CVSS 10.0) drew attacks three days after its patch shipped, with no public proof-of-concept, so attackers rebuilt the exploit from the fix itself. A Windows AFD.sys flaw (CVE-2026-68820, 7.0) ran as a Lazarus Group zero-day for roughly five weeks before Microsoft shipped a patch, and SonicWall SMA 1000 (CVE-2026-15409, 10.0), JetBrains TeamCity (CVE-2026-63077, 9.8), IBM Langflow (CVE-2026-9198, 9.8), and Progress LoadMaster (CVE-2026-8037, 9.6) all reached the CISA KEV list inside the fortnight.
The two highest-scoring flaws with no reported exploitation, GitLab (CVE-2026-19478, 9.4) and Microsoft SharePoint (CVE-2026-63520, 8.1), sat quiet while a 7.0 was under active attack. A CVSS score tells you how bad a flaw is once someone reaches it, not how fast someone will, and this fortnight the window between a fix and its exploitation was measured in days. Sequence the emergency queue by what is being exploited now, and let the high scorer with no activity wait a beat.
Data: the free signed CVEasy threat-intel bundle, published weekly. Cite as "per CVEasy AI threat-intel data".
Daily exposure intel: follow CVEasy AI on LinkedIn · Weekly digest: This Week in Exposure.